

Mackinac Financial Corporation Reports 2019 Fourth Quarter and Annual Results
/EIN News/ -- MANISTIQUE, Mich., Jan. 29, 2020 (GLOBE NEWSWIRE) -- Mackinac Financial Corporation (Nasdaq: MFNC) (the “Corporation”), the bank holding company for mBank, today announced 2019 net income of $13.85 million, or $1.29 per share, compared to 2018 net income of $8.37 million, or $.94 per share.
The 2019 results include the effects of a $140 thousand one-time non-cash amortization related to an acquired tax credit impacting tax expense (and tax rate). The 2018 results included expenses related to the acquisitions of First Federal of Northern Michigan (“FFNM”), and Lincoln Community Bank (“Lincoln”), which had a collective after-tax impact of $2.46 million on earnings. Adjusted core income (net of the one-time non-cash expense) for 2019 was $13.99 million, or $1.30 per share compared to 2018 adjusted core income (net of the transaction related expense) of $10.83 million, or $1.22 per share.
Weighted average shares outstanding for 2019 were 10,737,653 compared to 8,891,967 for 2018. Weighted average shares outstanding for the fourth quarter 2019 were 10,748,712 compared to 10,712,745 for the same period of 2018. The Corporation issued 2,146,378 new shares for the FFNM purchase in May, 2018 and issued an additional 2,225,807 shares in the common stock offering completed in June, 2018.
The Corporation had fourth quarter 2019 net income of $3.30 million, or $.31 per share, compared to 2018 fourth quarter net income of $3.36 million, or $.31 per share. The 2019 fourth quarter results include the effects of the $140 thousand one-time non-cash amortization of an acquired tax credit. The 2018 fourth quarter results were impacted by acquisition related expenses of $386 thousand on an after-tax basis. Adjusted core income (net of the one-time expenses) for the fourth quarter 2019 was $3.44 million, or $.32 per share, while 2018 fourth quarter income, excluding tax-affected transaction related expenses, was $3.75 million, or $.35 per share.
Total assets of the Corporation at December 31, 2019 were $1.32 billion, compared to $1.32 billion at December 31, 2018. Shareholders’ equity at December 31, 2019 totaled $161.92 million, compared to $152.07 million at December 31, 2018. Book value per share outstanding equated to $15.06 at year-end 2019, compared to $14.20 per share outstanding a year ago. Tangible book value at year-end 2019 was $137.30 million, or $12.77 per share outstanding compared to $124.33 million, or $11.61 per share, at year-end 2018.
Additional notes:
- mBank, the Corporation’s primary asset, recorded net income of $15.07 million in 2019, which resulted in an ROAA of 1.13%, compared to $9.04 million in 2018. Bank-level income was also impacted by the one-time $140 thousand tax credit amortization. In December, 2018, mBank had an internal tax allocation expense between it and the Corporation (MFNC) of $1.34 million. Adjusted core net income for 2019 was $15.21 million, compared to 2018 adjusted core net income (including total adjustments for the tax reallocation and transaction related expenses of $3.16 million on an after-tax basis) of $12.20 million. Adjusted bank core net income grew approximately 25% resulting in adjusted ROAA of 1.16% for 2019.
- Strong bank deposit activity drove increases of $56.28 million (or 5.9%) in 2019 through more proactive sales activity in the Treasury Management line of business and increased marketing efforts in key retail markets.
- Reliance on higher-cost brokered deposits continues to decrease significantly from $136.76 million, or 12.46% of total deposits at year-end 2018, to $58.62 million, or 5.44% of total deposits at year-end 2019.
- Overall new loan production for 2019 was $385.55 million, compared to $286.88 million for 2018, an increase of $98.67 million, or 34%.
- Fourth quarter 2019 net interest margin remained solid at 4.39%. Core operating margin for the fourth quarter, which is net of accretive yield from purchase accounting treatment on acquired loans (“accretion”), was 4.23%.
Revenue
Total revenue of the Corporation for 2019 was $70.34 million, compared to $59.64 million in 2018. Total revenue for the three months ended December 31, 2019 equated to $17.61 million, compared to $17.54 million for the same period of 2018.
- Total interest income for 2019 was $64.38 million, compared to $55.38 million for the same period in 2018. Fourth quarter 2019 interest income equated to $15.77 million, compared to $16.09 million in the fourth quarter of 2018.
- 2019 Noninterest Income was $5.95 million compared to $4.26 million for 2018. Fourth quarter 2019 noninterest income was $1.85 million, compared to $1.44 million for the same period of 2018.
The year-over-year improvement is a combination of the operating scale provided by the two 2018 acquisitions, as well as continued focus on drivers of noninterest income, including secondary market mortgage and SBA loan guarantee sales. The 2019 fourth quarter interest income included accretive yield of $488 thousand from combined credit mark accretion associated with acquisitions, compared to $946 thousand in the same period of 2018.
Loan Production and Portfolio Mix
Total balance sheet loans at December 31, 2019 were $1.06 billion, compared to December 31, 2018 balances of $1.04 billion. Total loans under management reside at $1.36 billion, which includes $297.41 million of service retained loans. Loan production for the fourth quarter of 2019 was $96.40 million, compared to $82.91 million for the fourth quarter of 2018. Increased production was evident in all lines of business and across the entire market footprint, but driven primarily through commercial lending activities, which were up $65 million year-over-year. The Corporation also saw an increase in secondary market mortgage production in light of the drop in market rates that most other banks also experienced. New production efforts have resulted in 2019 organic balance sheet loan growth of $20 million, or annualized growth of approximately 2%.
A photo accompanying this announcement is available at https://www.globenewswire.com/NewsRoom/AttachmentNg/a0ceb772-8f8f-48e9-9ece-651a7533a9f8
A table accompanying this announcement is available at https://www.globenewswire.com/NewsRoom/AttachmentNg/9b19d542-b697-4622-8713-ce626a950595
Payoff activity, outside of normal amortization, continued to constrain portfolio growth with approximately $140 million of total principal reduction ahead of original terms during 2019. Of this amount, $89 million came from the commercial portfolio, with $32 million of the total being related to borrowers divesting of the collateral and $28 million refinanced at pricing or terms that the Corporation was not able or willing to offer.
A photo accompanying this announcement is available at https://www.globenewswire.com/NewsRoom/AttachmentNg/beda9321-30c5-48cc-b5fe-80e3622c476f
Commenting on new loan production and overall lending activities, President of the Corporation and President and CEO of mBank, Kelly W. George, stated, “Our new loan production in 2019 ended in line with our yearly targets and we remain pleased with the origination activity in our lending business. We continue to see good loan opportunities in all of our markets, both on the commercial and retail side, with a solid pipeline moving into 2020. However, payoff activity has remained consistently higher than normal through 2019, which impeded balance sheet growth. More normalized levels would have resulted in portfolio growth in the 5% to 7% range, which were our expectations. Sale of businesses or collateral and terms outside our lending parameters, both from a yield and structure standpoint from a variety of lending conduits, were the primary drivers of payoff activity within the commercial line of business.”
Credit Quality
Nonperforming loans totaled $5.18 million, or .49% of total loans at December 31, 2019, compared to $5.08 million, or .49% of total loans at December 31, 2018. Total loan delinquencies greater than 30 days resided at a nominal 1.1%, compared to .96% at year end 2018. The nonperforming assets to total assets ratio resided at .56% for the fourth quarter of 2019, compared to .62% for the fourth quarter of 2018. Commenting on overall credit risk, Mr. George stated, “Credit quality of the Corporation remains very solid. We have seen no adverse systemic risk indicators within any of our lending lines of business. We believe that stable market conditions and forecasted lower rates should help continue this positive trend into 2020. Purchase accounting marks from the previously acquired banks have continued to prove accurate, attaining expected accretion levels, which should continue into future periods.”
Margin Analysis and Funding
Net interest income for 2019 was $53.91 million, equating to a Net Interest Margin (“NIM”) of 4.57%, compared to $47.13 million in 2018 and a NIM of 4.44%. Core operating margin, which is net of accretion from acquired loans that were subject to purchase accounting adjustments, was 4.39% for 2019 and 4.21% for 2018. Net interest income for the fourth quarter of 2019 was $13.35 million, with $488 thousand of accretion, resulting in a Net Interest Margin of 4.39%, compared to $13.795 million in the fourth quarter of 2018, with $946 thousand of accretion and a NIM of 4.64%. Core operating margin, which is net of accretion from acquired loans, was 4.23% for the fourth quarter 2019 and 4.32% for the same period of 2018.
As illustrated in the chart below, core NIM remains comparatively strong but was negatively impacted, as were the margins of most banks, by the Federal Reserve Bank (the “Fed”) rate moves in the third and fourth quarters. The Fed activity primarily impacted the Corporation’s prime-based variable rate loan portfolio.
A photo accompanying this announcement is available at https://www.globenewswire.com/NewsRoom/AttachmentNg/a5311e5f-3551-4bee-b498-6b20c2dabe1e
Total bank deposits have increased by $56.28 million year-over-year from $960.78 million at December, 2018 to $1.02 billion at year-end 2019 as a result of strong organic efforts. Total brokered deposits have decreased significantly and were $58.62 million at December 31, 2019, compared to $136.76 million at December 31, 2018, a decrease of 56%. FHLB (Federal Home Loan Bank) and other borrowings were slightly increased to $64.55 million at the end of the fourth quarter 2019 from $57.54 million at the end of the fourth quarter 2018. This increase was due to the Corporation opportunistically extending the duration of roughly $25 million of liability funding to take advantage of the inverted yield curve in mid-2019. The overall duration of wholesale funding remains very manageable and short term in nature.
Mr. George stated, “The Corporation’s margin remains strong despite the three Fed rate cuts. We have maintained discipline on pricing of both the loan and deposit portfolio, while being proactive to market competition in managing offered rates. With our bank deposits up roughly $56 million since year-end 2018, our strong liquidity position has allowed for continued reduction in higher cost brokered deposits over the course of 2019, which strengthens our balance sheet. Our focus on new core deposit procurement remains a key initiative for 2020, as we will look to continue to wind down our wholesale funding exposure through aggressive marketing and business development initiatives in our retail banking commerce hubs and within our Treasury Management line of business throughout our entire footprint.”
Operating Expenses
Total 2019 noninterest expense was $41.77 million, or roughly $10.45 million average per quarter, compared to $40.30 million for full year 2018, or $10.08 million average per quarter. The increase is directly related to the larger operating platform following the multiple acquisitions in 2018 and the increase in overall employee base that was fully in place in 2019. Noninterest expense for the fourth quarter of 2019 was $10.81 million, compared to $10.68 million for the same period of 2018. Fourth quarter 2019 noninterest expense was impacted by a $120 thousand pre-tax non-cash Director compensation item, and to a lesser degree, some seasonal occupancy and benefit related expenses.
Assets and Capital
Total assets of the Corporation at December 31, 2019 were $1.32 billion, compared to $1.32 billion at December 31, 2018. Shareholders’ equity at December 31, 2019 totaled $161.92 million, compared to $152.07 million at December 31, 2018. Book value per share outstanding equated to $15.06 at year-end 2019, compared to $14.20 per share outstanding a year ago. Tangible book value at year-end 2019 was $137.30 million, or $12.77 per share, compared to $124.33 million, or $11.61 per share, at year-end 2018. Both the Corporation and the Bank are “well-capitalized” with total risk-based capital to risk-weighted assets of 13.22% and 13.06%, respectively, and tier 1 capital to total tier 1 average assets at the Corporation of 10.09% and at the Bank of 9.96%.
Paul D. Tobias, Chairman and Chief Executive Officer of the Corporation and Chairman of mBank concluded, “Overall we are pleased with the Corporation’s performance in 2019. As did most financial institutions, we saw the effects of the interest rate environment shift on our second-half earnings. However, our strong core bank fundamentals allowed us to record improved year-over-year earnings per share and increase shareholder value while increasing our dividend and at the same time maintaining our safe and sound risk profile.”
Mackinac Financial Corporation is a registered bank holding company formed under the Bank Holding Company Act of 1956 with assets in excess of $1.3 billion and whose common stock is traded on the NASDAQ stock market as “MFNC.” The principal subsidiary of the Corporation is mBank. Headquartered in Manistique, Michigan, mBank has 29 branch locations; eleven in the Upper Peninsula, ten in the Northern Lower Peninsula, one in Oakland County, Michigan, and seven in Northern Wisconsin. The Corporation’s banking services include commercial lending and treasury management products and services geared toward small to mid-sized businesses, as well as a full array of personal and business deposit products and consumer loans.
Forward-Looking Statements
This release contains certain forward-looking statements. Words such as “anticipates,” “believes,” “estimates,” “expects,” “intends,” “should,” “will,” and variations of such words and similar expressions are intended to identify forward-looking statements: as defined by the Private Securities Litigation Reform Act of 1995. These statements reflect management’s current beliefs as to expected outcomes of future events and are not guarantees of future performance. These statements involve certain risks, uncertainties and assumptions that are difficult to predict with regard to timing, extent, likelihood, and degree of occurrence. Therefore, actual results and outcomes may materially differ from what may be expressed or forecasted in such forward-looking statements. Factors that could cause a difference include among others: changes in the national and local economies or market conditions; changes in interest rates and banking regulations; the impact of competition from traditional or new sources; and the possibility that anticipated cost savings and revenue enhancements from mergers and acquisitions, bank consolidations, and other sources may not be fully realized at all or within specified time frames as well as other risks and uncertainties including but not limited to those detailed from time to time in filings of the Corporation with the Securities and Exchange Commission. These and other factors may cause decisions and actual results to differ materially from current expectations. Mackinac Financial Corporation undertakes no obligation to revise, update, or clarify forward-looking statements to reflect events or conditions after the date of this release.
| MACKINAC FINANCIAL CORPORATION AND SUBSIDIARIES | |||||||
| SELECTED FINANCIAL HIGHLIGHTS | |||||||
| As of and For the | As of and For the | ||||||
| Period Ending | Year Ending | ||||||
| December 31, | December 31, | ||||||
| (Dollars in thousands, except per share data) | 2019 | 2018 | |||||
| (Unaudited) | (Unaudited) | ||||||
| Selected Financial Condition Data (at end of period): | |||||||
| Assets | $ | 1,320,069 | $ | 1,318,040 | |||
| Loans | 1,058,776 | 1,038,864 | |||||
| Investment securities | 107,972 | 116,748 | |||||
| Deposits | 1,075,677 | 1,097,537 | |||||
| Borrowings | 64,551 | 60,441 | |||||
| Shareholders' equity | 161,919 | 152,069 | |||||
| Selected Statements of Income Data: | |||||||
| Net interest income | $ | 53,907 | $ | 47,130 | |||
| Income before taxes | 17,710 | 10,593 | |||||
| Net income | 13,850 | 8,367 | |||||
| Income per common share - Basic | 1.29 | 0.94 | |||||
| Income per common share - Diluted | 1.29 | 0.94 | |||||
| Weighted average shares outstanding - Basic | 10,737,653 | 8,891,967 | |||||
| Weighted average shares outstanding- Diluted | 10,757,507 | 8,921,658 | |||||
| Selected Financial Ratios and Other Data: | |||||||
| Performance Ratios: | |||||||
| Net interest margin | 4.57 | % | 4.44 | % | |||
| Efficiency ratio | 69.10 | 77.70 | |||||
| Return on average assets | 1.04 | 0.71 | |||||
| Return on average equity | 8.78 | 6.94 | |||||
| Average total assets | $ | 1,332,882 | $ | 1,177,455 | |||
| Average total shareholders' equity | 157,831 | 120,478 | |||||
| Average loans to average deposits ratio | 95.03 | % | 97.75 | % | |||
| Common Share Data at end of period: | |||||||
| Market price per common share | $ | 17.56 | $ | 13.65 | |||
| Book value per common share | 15.06 | 14.20 | |||||
| Tangible book value per share | 12.77 | 11.61 | |||||
| Dividends paid per share, annualized | 0.520 | 0.480 | |||||
| Common shares outstanding | 10,748,712 | 10,712,745 | |||||
| Other Data at end of period: | |||||||
| Allowance for loan losses | $ | 5,308 | $ | 5,183 | |||
| Non-performing assets | 7,377 | 8,196 | |||||
| Allowance for loan losses to total loans | 0.49 | % | 0.50 | % | |||
| Non-performing assets to total assets | 0.56 | % | 0.62 | % | |||
| Texas ratio | 4.41 | % | 6.33 | % | |||
| Number of: | |||||||
| Branch locations | 29 | 29 | |||||
| FTE Employees | 304 | 288 | |||||
| MACKINAC FINANCIAL CORPORATION AND SUBSIDIARIES | ||||||||
| CONSOLIDATED BALANCE SHEETS | ||||||||
| December 31, | December 31, | |||||||
| 2019 | 2018 | |||||||
| (Unaudited) | (Audited) | |||||||
| ASSETS | ||||||||
| Cash and due from banks | $ | 49,794 | $ | 64,151 | ||||
| Federal funds sold | 32 | 6 | ||||||
| Cash and cash equivalents | 49,826 | 64,157 | ||||||
| Interest-bearing deposits in other financial institutions | 10,295 | 13,452 | ||||||
| Securities available for sale | 107,972 | 116,748 | ||||||
| Federal Home Loan Bank stock | 4,924 | 4,924 | ||||||
| Loans: | ||||||||
| Commercial | 765,524 | 717,032 | ||||||
| Mortgage | 272,014 | 301,461 | ||||||
| Consumer | 21,238 | 20,371 | ||||||
| Total Loans | 1,058,776 | 1,038,864 | ||||||
| Allowance for loan losses | (5,308 | ) | (5,183 | ) | ||||
| Net loans | 1,053,468 | 1,033,681 | ||||||
| Premises and equipment | 23,608 | 22,783 | ||||||
| Other real estate held for sale | 2,194 | 3,119 | ||||||
| Deferred tax asset | 3,732 | 5,763 | ||||||
| Deposit based intangibles | 5,043 | 5,720 | ||||||
| Goodwill | 19,574 | 22,024 | ||||||
| Other assets | 39,433 | 25,669 | ||||||
| TOTAL ASSETS | $ | 1,320,069 | $ | 1,318,040 | ||||
| LIABILITIES AND SHAREHOLDERS’ EQUITY | ||||||||
| LIABILITIES: | ||||||||
| Deposits: | ||||||||
| Noninterest bearing deposits | $ | 287,611 | $ | 241,556 | ||||
| NOW, money market, interest checking | 373,165 | 368,890 | ||||||
| Savings | 109,548 | 111,358 | ||||||
| CDs<$250,000 | 233,956 | 225,236 | ||||||
| CDs>$250,000 | 12,775 | 13,737 | ||||||
| Brokered | 58,622 | 136,760 | ||||||
| Total deposits | 1,075,677 | 1,097,537 | ||||||
| Federal funds purchased | 6,225 | 2,905 | ||||||
| Borrowings | 64,551 | 57,536 | ||||||
| Other liabilities | 11,697 | 7,993 | ||||||
| Total liabilities | 1,158,150 | 1,165,971 | ||||||
| SHAREHOLDERS’ EQUITY: | ||||||||
| Common stock and additional paid in capital - No par value Authorized - 18,000,000 shares Issued and outstanding - 10,748,712 and 10,712,745 respectively | 129,564 | 129,066 | ||||||
| Retained earnings | 31,740 | 23,466 | ||||||
| Accumulated other comprehensive income (loss) | ||||||||
| Unrealized (losses) gains on available for sale securities | 1,025 | (245 | ) | |||||
| Minimum pension liability | (410 | ) | (218 | ) | ||||
| Total shareholders’ equity | 161,919 | 152,069 | ||||||
| TOTAL LIABILITIES AND SHAREHOLDERS’ EQUITY | $ | 1,320,069 | $ | 1,318,040 | ||||
| MACKINAC FINANCIAL CORPORATION AND SUBSIDIARIES | ||||||||||
| CONSOLIDATED STATEMENTS OF OPERATIONS | ||||||||||
| For the Years Ended | ||||||||||
| December 31, | ||||||||||
| 2019 | 2018 | 2017 | ||||||||
| (Unaudited) | (Audited) | (Audited) | ||||||||
| INTEREST INCOME: | ||||||||||
| Interest and fees on loans: | ||||||||||
| Taxable | $ | 59,673 | $ | 51,407 | $ | 41,770 | ||||
| Tax-exempt | 187 | 123 | 95 | |||||||
| Interest on securities: | ||||||||||
| Taxable | 2,708 | 2,408 | 1,606 | |||||||
| Tax-exempt | 343 | 338 | 298 | |||||||
| Other interest income | 1,473 | 1,101 | 607 | |||||||
| Total interest income | 64,384 | 55,377 | 44,376 | |||||||
| INTEREST EXPENSE: | ||||||||||
| Deposits | 9,436 | 6,492 | 4,361 | |||||||
| Borrowings | 1,041 | 1,755 | 2,077 | |||||||
| Total interest expense | 10,477 | 8,247 | 6,438 | |||||||
| Net interest income | 53,907 | 47,130 | 37,938 | |||||||
| Provision for loan losses | 385 | 500 | 625 | |||||||
| Net interest income after provision for loan losses | 53,522 | 46,630 | 37,313 | |||||||
| OTHER INCOME: | ||||||||||
| Deposit service fees | 1,586 | 1,441 | 1,056 | |||||||
| Income from loans sold on the secondary market | 1,889 | 1,289 | 1,373 | |||||||
| SBA/USDA loan sale gains | 908 | 661 | 867 | |||||||
| Mortgage servicing amortization | 693 | 197 | (31 | ) | ||||||
| Net security gains | 208 | - | 231 | |||||||
| Other | 669 | 675 | 545 | |||||||
| Total other income | 5,953 | 4,263 | 4,041 | |||||||
| OTHER EXPENSE: | ||||||||||
| Salaries and employee benefits | 22,743 | 20,064 | 15,490 | |||||||
| Occupancy | 4,069 | 3,640 | 3,104 | |||||||
| Furniture and equipment | 3,000 | 2,548 | 2,209 | |||||||
| Data processing | 2,717 | 2,503 | 2,037 | |||||||
| Advertising | 889 | 905 | 711 | |||||||
| Professional service fees | 2,100 | 1,575 | 1,534 | |||||||
| Loan origination expenses and deposit and card related fees | 1,546 | 1,166 | 1,335 | |||||||
| Writedowns and losses on other real estate held for sale | 212 | 182 | 388 | |||||||
| FDIC insurance assessment | 70 | 700 | 731 | |||||||
| Communications expense | 885 | 726 | 604 | |||||||
| Transaction related expenses | - | 2,951 | 50 | |||||||
| Other | 3,534 | 3,340 | 2,143 | |||||||
| Total other expenses | 41,765 | 40,300 | 30,336 | |||||||
| Income before provision for income taxes | 17,710 | 10,593 | 11,018 | |||||||
| Provision for income taxes | 3,860 | 2,226 | 5,539 | |||||||
| NET INCOME AVAILABLE TO COMMON SHAREHOLDERS | $ | 13,850 | $ | 8,367 | $ | 5,479 | ||||
| INCOME PER COMMON SHARE: | ||||||||||
| Basic | $ | 1.29 | $ | 0.94 | $ | 0.87 | ||||
| Diluted | $ | 1.29 | $ | 0.94 | $ | 0.87 | ||||
| MACKINAC FINANCIAL CORPORATION AND SUBSIDIARIES | ||||||
| LOAN PORTFOLIO AND CREDIT QUALITY | ||||||
| (Dollars in thousands) | ||||||
| Loan Portfolio Balances (at end of period) | ||||||
| December 31, | December 31, | |||||
| 2019 | 2018 | |||||
| (Unaudited) | (Unaudited) | |||||
| Commercial Loans: | ||||||
| Real estate - operators of nonresidential buildings | $ | 141,965 | $ | 150,251 | ||
| Hospitality and tourism | 97,721 | 77,598 | ||||
| Lessors of residential buildings | 51,085 | 50,204 | ||||
| Gasoline stations and convenience stores | 27,176 | 24,189 | ||||
| Logging | 22,136 | 20,860 | ||||
| Commercial construction | 40,107 | 29,765 | ||||
| Other | 385,334 | 364,165 | ||||
| Total Commercial Loans | 765,524 | 717,032 | ||||
| 1-4 family residential real estate | 253,918 | 286,908 | ||||
| Consumer | 21,238 | 20,371 | ||||
| Consumer construction | 18,096 | 14,553 | ||||
| Total Loans | $ | 1,058,776 | $ | 1,038,864 | ||
| Credit Quality (at end of period): | ||||||
| December 31, | December 31, | |||||
| 2019 | 2018 | |||||
| (Unaudited) | (Unaudited) | |||||
| Nonperforming Assets : | ||||||
| Nonaccrual loans | $ | 5,172 | $ | 5,054 | ||
| Loans past due 90 days or more | 11 | 23 | ||||
| Restructured loans | - | - | ||||
| Total nonperforming loans | 5,183 | 5,077 | ||||
| Other real estate owned | 2,194 | 3,119 | ||||
| Total nonperforming assets | $ | 7,377 | $ | 8,196 | ||
| Nonperforming loans as a % of loans | 0.49 | % | 0.49 | % | ||
| Nonperforming assets as a % of assets | 0.56 | % | 0.62 | % | ||
| Reserve for Loan Losses: | ||||||
| At period end | $ | 5,308 | $ | 5,183 | ||
| As a % of outstanding loans | 0.50 | % | 0.50 | % | ||
| As a % of nonperforming loans | 102.41 | % | 102.09 | % | ||
| As a % of nonaccrual loans | 102.63 | % | 102.55 | % | ||
| Texas Ratio | 4.41 | % | 6.33 | % | ||
| Charge-off Information (year to date): | ||||||
| Average loans | $ | 1,047,439 | $ | 941,221 | ||
| Net charge-offs (recoveries) | $ | 260 | $ | 396 | ||
| Charge-offs as a % of average | ||||||
| loans, annualized | 0.02 | % | 0.04 | % | ||
| MACKINAC FINANCIAL CORPORATION AND SUBSIDIARIES | ||||||||||||||||||||
| QUARTERLY FINANCIAL HIGHLIGHTS | ||||||||||||||||||||
| QUARTER ENDED | ||||||||||||||||||||
| (Unaudited) | ||||||||||||||||||||
| December 31, | September 30, | June 30, | March 31, | December 31 | ||||||||||||||||
| 2019 | 2019 | 2019 | 2019 | 2018 | ||||||||||||||||
| BALANCE SHEET (Dollars in thousands) | ||||||||||||||||||||
| Total loans | $ | 1,058,776 | $ | 1,059,942 | $ | 1,060,703 | $ | 1,045,428 | $ | 1,038,864 | ||||||||||
| Allowance for loan losses | (5,308 | ) | (5,308 | ) | (5,306 | ) | (5,154 | ) | (5,183 | ) | ||||||||||
| Total loans, net | 1,053,468 | 1,054,634 | 1,055,397 | 1,040,274 | 1,033,681 | |||||||||||||||
| Total assets | 1,320,069 | 1,355,383 | 1,330,723 | 1,316,996 | 1,318,040 | |||||||||||||||
| Core deposits | 1,004,280 | 1,022,115 | 989,116 | 965,359 | 947,040 | |||||||||||||||
| Noncore deposits | 71,397 | 91,464 | 125,737 | 131,889 | 150,497 | |||||||||||||||
| Total deposits | 1,075,677 | 1,113,579 | 1,114,853 | 1,097,248 | 1,097,537 | |||||||||||||||
| Total borrowings | 64,551 | 70,079 | 46,232 | 53,678 | 60,441 | |||||||||||||||
| Total shareholders' equity | 161,919 | 160,165 | 157,840 | 154,746 | 152,069 | |||||||||||||||
| Total tangible equity | 137,302 | 135,379 | 133,236 | 129,973 | 124,325 | |||||||||||||||
| Total shares outstanding | 10,748,712 | 10,740,712 | 10,740,712 | 10,740,712 | 10,712,745 | |||||||||||||||
| Weighted average shares outstanding | 10,748,712 | 10,740,712 | 10,740,712 | 10,720,127 | 10,712,745 | |||||||||||||||
| AVERAGE BALANCES (Dollars in thousands) | ||||||||||||||||||||
| Assets | $ | 1,347,916 | $ | 1,354,220 | $ | 1,326,827 | $ | 1,320,080 | $ | 1,320,996 | ||||||||||
| Earning assets | 1,205,241 | 1,204,782 | 1,179,584 | 1,180,989 | 1,179,934 | |||||||||||||||
| Loans | 1,081,294 | 1,065,337 | 1,051,998 | 1,046,740 | 1,043,409 | |||||||||||||||
| Noninterest bearing deposits | 283,259 | 284,354 | 260,441 | 235,247 | 260,846 | |||||||||||||||
| Deposits | 1,080,359 | 1,124,433 | 1,103,413 | 1,099,644 | 1,087,174 | |||||||||||||||
| Equity | 161,588 | 159,453 | 156,491 | 153,689 | 149,241 | |||||||||||||||
| INCOME STATEMENT (Dollars in thousands) | ||||||||||||||||||||
| Net interest income | $ | 13,350 | $ | 13,324 | $ | 13,997 | $ | 13,236 | $ | 13,795 | ||||||||||
| Provision for loan losses | 35 | 50 | 200 | 100 | 300 | |||||||||||||||
| Net interest income after provision | 13,315 | 13,274 | 13,797 | 13,136 | 13,495 | |||||||||||||||
| Total noninterest income | 1,848 | 1,878 | 1,110 | 1,117 | 1,443 | |||||||||||||||
| Total noninterest expense | 10,813 | 10,444 | 10,263 | 10,244 | 10,678 | |||||||||||||||
| Income before taxes | 4,350 | 4,708 | 4,644 | 4,009 | 4,260 | |||||||||||||||
| Provision for income taxes | 1,054 | 989 | 975 | 842 | 895 | |||||||||||||||
| Net income available to common shareholders | $ | 3,296 | $ | 3,719 | $ | 3,669 | $ | 3,167 | $ | 3,365 | ||||||||||
| Income pre-tax, pre-provision | $ | 4,385 | $ | 4,758 | $ | 4,844 | $ | 4,109 | $ | 4,560 | ||||||||||
| PER SHARE DATA | ||||||||||||||||||||
| Earnings per common share | $ | 0.31 | $ | 0.35 | $ | 0.34 | $ | 0.30 | $ | 0.31 | ||||||||||
| Book value per common share | 15.06 | 14.91 | 14.70 | 14.41 | 14.20 | |||||||||||||||
| Tangible book value per share | 12.77 | 12.60 | 12.40 | 12.10 | 11.61 | |||||||||||||||
| Market value, closing price | 17.56 | 15.46 | 15.80 | 15.74 | 13.65 | |||||||||||||||
| Dividends per share | 0.140 | 0.140 | 0.120 | 0.120 | 0.120 | |||||||||||||||
| ASSET QUALITY RATIOS | ||||||||||||||||||||
| Nonperforming loans/total loans | 0.49 | % | 0.46 | % | 0.44 | % | 0.53 | % | 0.49 | % | ||||||||||
| Nonperforming assets/total assets | 0.56 | 0.55 | 0.51 | 0.57 | 0.62 | |||||||||||||||
| Allowance for loan losses/total loans | 0.50 | 0.50 | 0.50 | 0.49 | 0.50 | |||||||||||||||
| Allowance for loan losses/nonperforming loans | 102.41 | 109.33 | 113.55 | 92.23 | 102.09 | |||||||||||||||
| Texas ratio | 4.41 | 5.31 | 4.91 | 5.59 | 6.33 | |||||||||||||||
| PROFITABILITY RATIOS | ||||||||||||||||||||
| Return on average assets | 0.97 | % | 1.09 | % | 1.11 | % | 0.97 | % | 1.01 | % | ||||||||||
| Return on average equity | 8.09 | 9.25 | 9.40 | 8.36 | 8.95 | |||||||||||||||
| Net interest margin | 4.39 | 4.39 | 4.76 | 4.55 | 4.64 | |||||||||||||||
| Average loans/average deposits | 100.09 | 94.74 | 95.34 | 95.10 | 95.97 | |||||||||||||||
| CAPITAL ADEQUACY RATIOS | ||||||||||||||||||||
| Tier 1 leverage ratio | 10.09 | % | 9.81 | % | 9.74 | % | 9.54 | % | 9.24 | % | ||||||||||
| Tier 1 capital to risk weighted assets | 12.71 | 12.39 | 12.20 | 12.28 | 11.95 | |||||||||||||||
| Total capital to risk weighted assets | 13.22 | 12.90 | 12.72 | 12.79 | 12.47 | |||||||||||||||
| Average equity/average assets (for the quarter) | 11.99 | 11.77 | 11.80 | 11.64 | 11.30 | |||||||||||||||
| Tangible equity/tangible assets (at quarter end) | 10.17 | 10.20 | 10.06 | 9.64 | ||||||||||||||||
| Contact: | Jesse A. Deering, EVP & Chief Financial Officer (248) 290-5906 /jdeering@bankmbank.com |
| Website: | www.bankmbank.com |

Overall Quarterly Loan Production
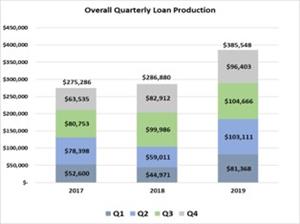
Overall Quarterly Loan Production
2019 New Loan Production
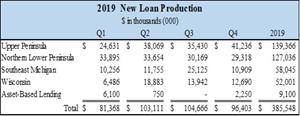
2019 New Loan Production
Total Loans by Region December 31, 2019
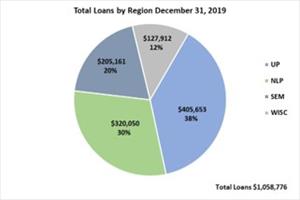
Total Loans by Region December 31, 2019
Margin Analysis Per Quarter
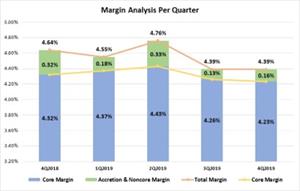
Margin Analysis Per Quarter
EIN Presswire does not exercise editorial control over third-party content provided, uploaded, published, or distributed by users of EIN Presswire. We are a distributor, not a publisher, of 3rd party content. Such content may contain the views, opinions, statements, offers, and other material of the respective users, suppliers, participants, or authors.